Previously, I’ve written about maps and layers in General Staff (here). A General Staff map is made up of background, elevation, terrain, slope, units, AI, water and road layers. Recently, while working with scans of very old battlefield maps, I discovered an amazing effect.
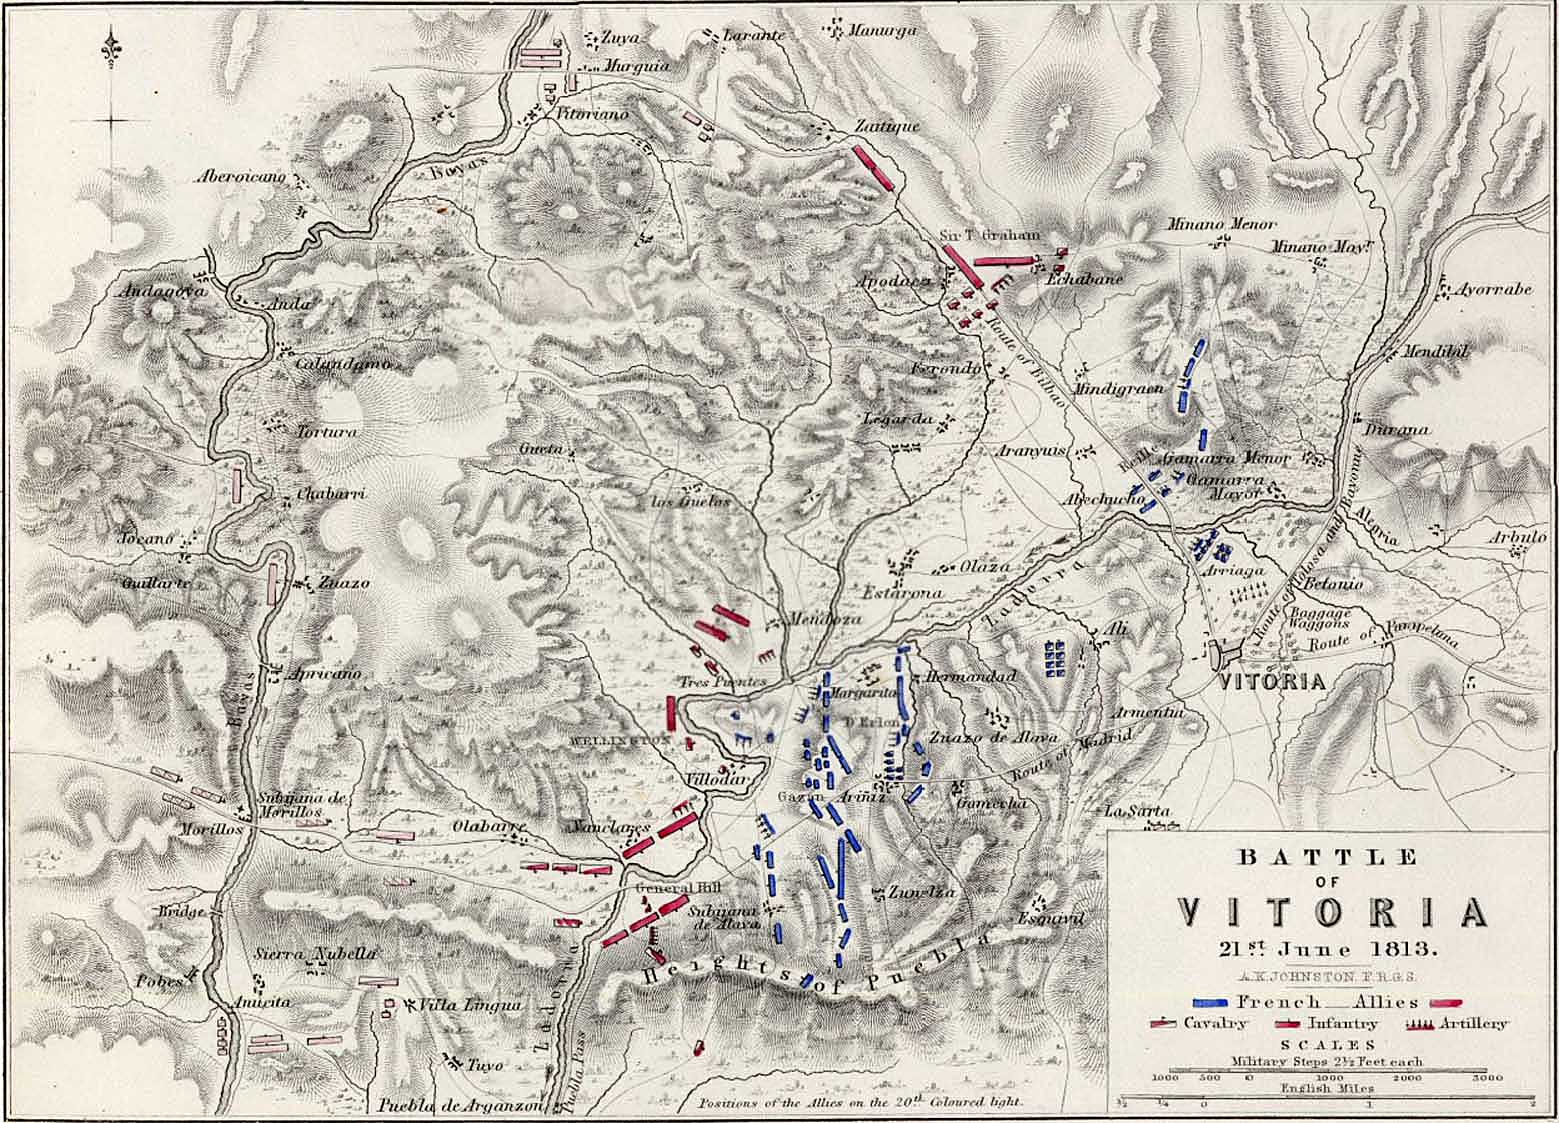
The battle of Vitoria. From, an “Atlas to Alison’s History of Europe: Constructed and Arranged, Under the Direction of Mr. Alison. 12 volume History of Europe (An Attractive And Complete Set Of Books Comprising Alison’s Europe).” The maps are made by W & A K Johnston Ltd, one of the major map publishing houses of the 19th century. William Johnston (1802–1888) and his brother Alexander Keith Johnston (1804–1871) originally trained as engravers, and founded the firm in 1826. The atlas, prepared by A K Johnston, was published by Wm Blackwood & Sons around 1850. Thank you, Mike Oliver for this background information on this map and the atlas that it came from. Click to enlarge.
The above map comes from a wonderful atlas illustrating numerous Napoleonic era battles. These are the kinds of maps that inspired General Staff. As a kid I used to look at similar maps (and, of course, The West Point Atlas of American Wars) and imagine commanding units on the battlefield. The problem with maps like these is that they don’t actually contain any data that computers can use. Humans can look at the above map and see hills, valleys, towns and rivers. But, to a computer, this is just another image. The process of converting this map into computer usable data involves the General Staff Map Editor.
Ed Kuhrt, my old friend, superb musician, talented jeweler (he made my wife’s heart-shaped diamond ring), and excellent artist made this height map from the original map (above) using PhotoShop; though he could have used the General Staff Map Editor and a digitizing tablet as well.
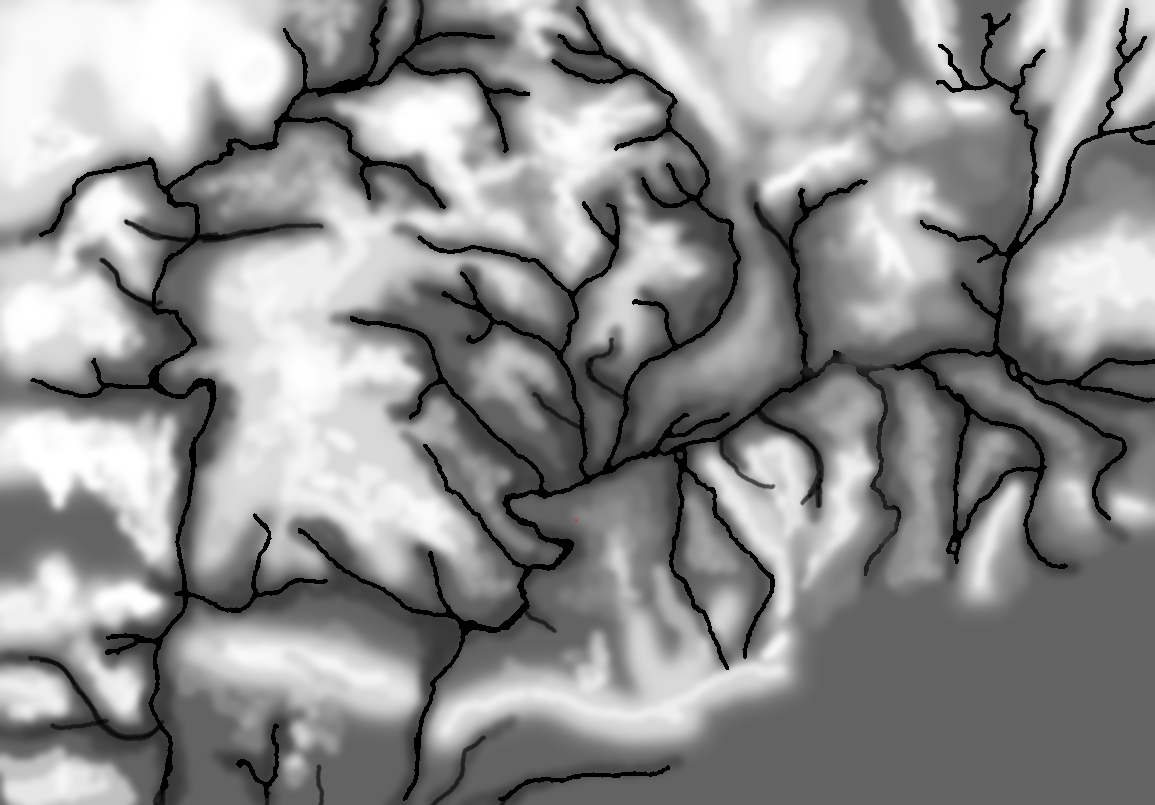
Height – or elevation – map produced by Ed Kuhrt from the Vitoria battlefield map. Click to enlarge.
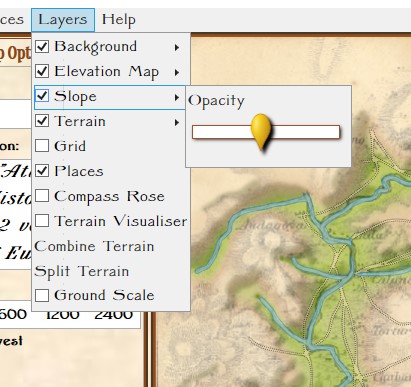
A slider and checkbox for adjusting the visibility (transparency) of the Slope Layer in the Map Editor.
Prior to this Andy O’Neill had just implemented precalculating slopes. In my original work with least weighted paths and slopes I calculated slope ‘on the fly’. Andy, quite correctly, realized that these values could be calculated in advance and stored as part of the map data. This, of course, would save time when calculating optimal paths for units (and also calculating combat equations which involve slope). Consequently, Andy added another visual layer – a slope layer – to visualize the slopes (see right).
It was while working in the Map Editor with the Vitoria battle map, and adjusting the sliders for the various layers that I discovered this amazing effect: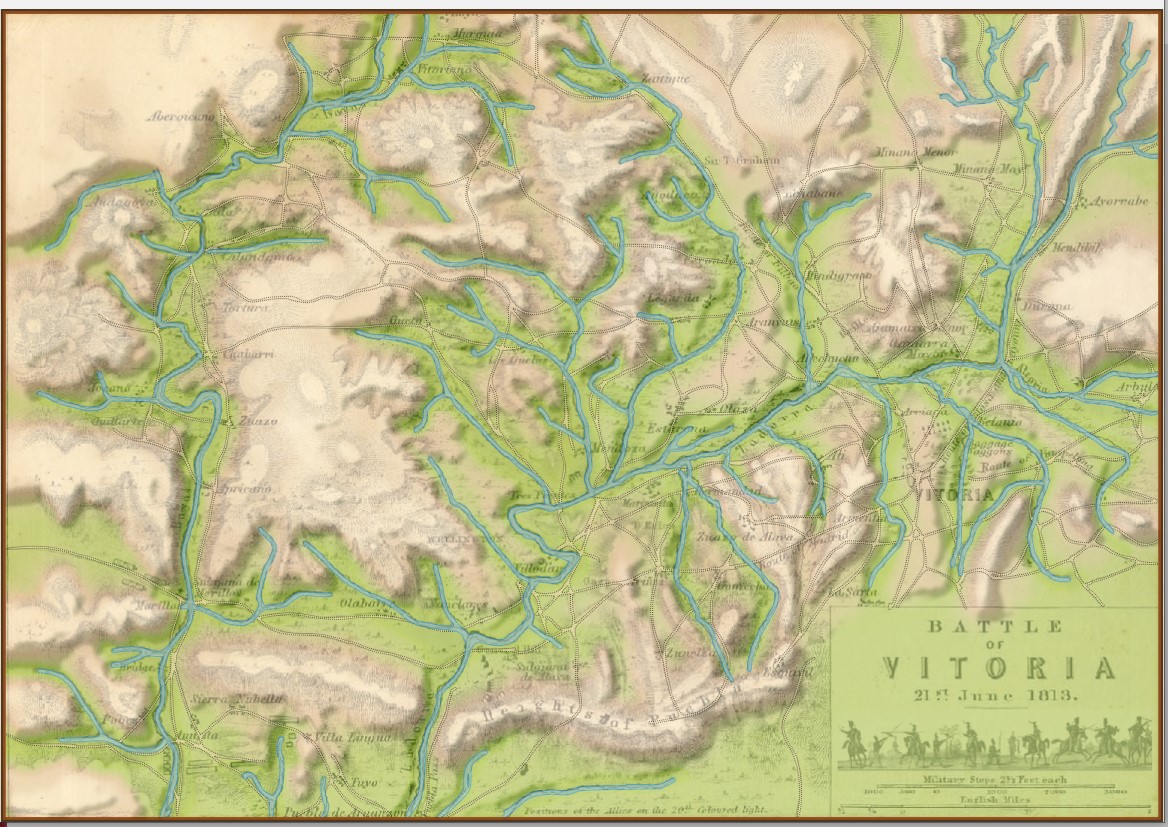 This map (above) certainly reminds me the plastic 3D maps we used to see back in grade school. I think they look fantastic. Here are some more:
This map is from the US Library of Congress and can be downloaded here.
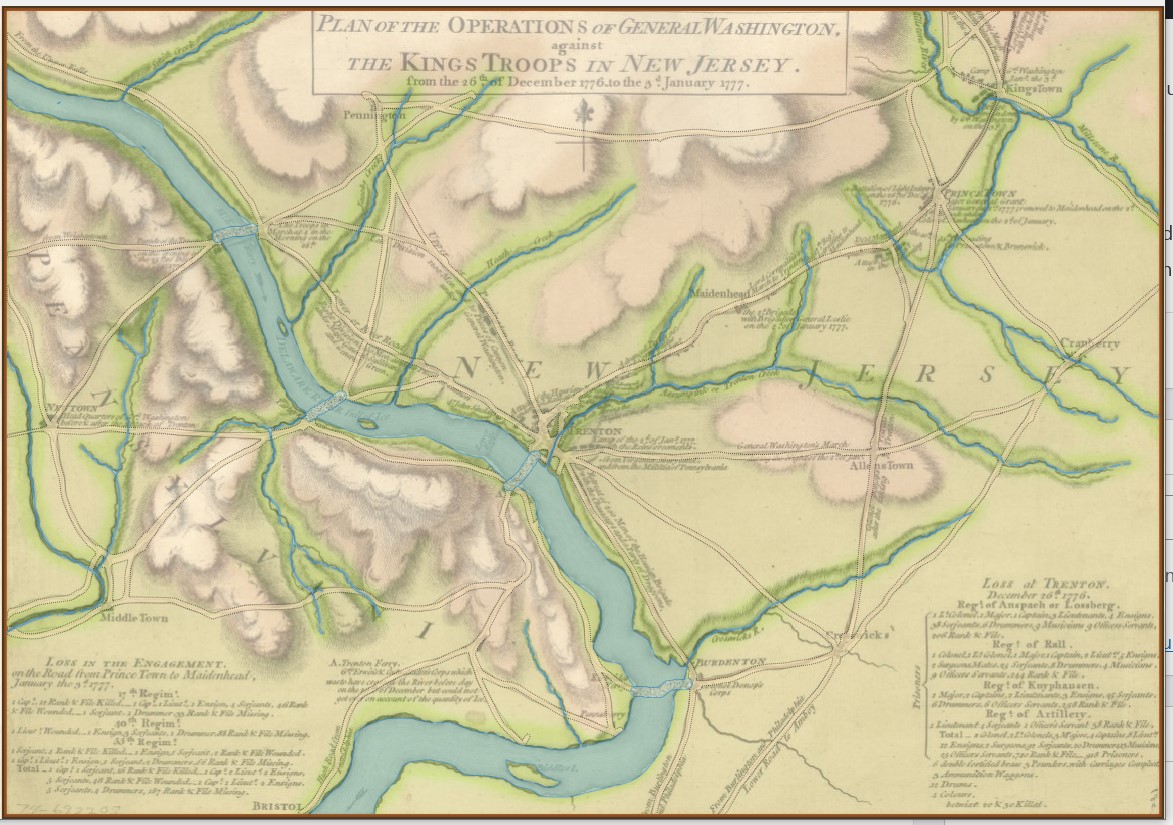
Trenton map with slope and elevation increased. Click to enlarge.
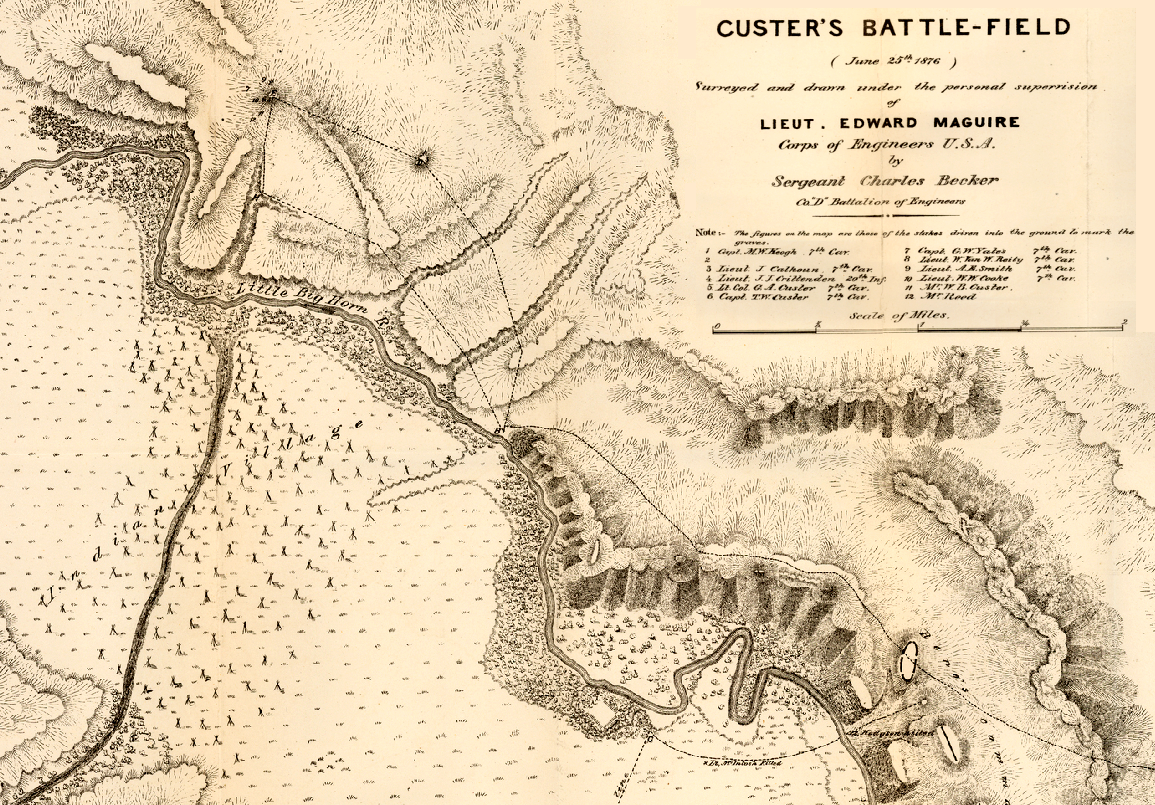
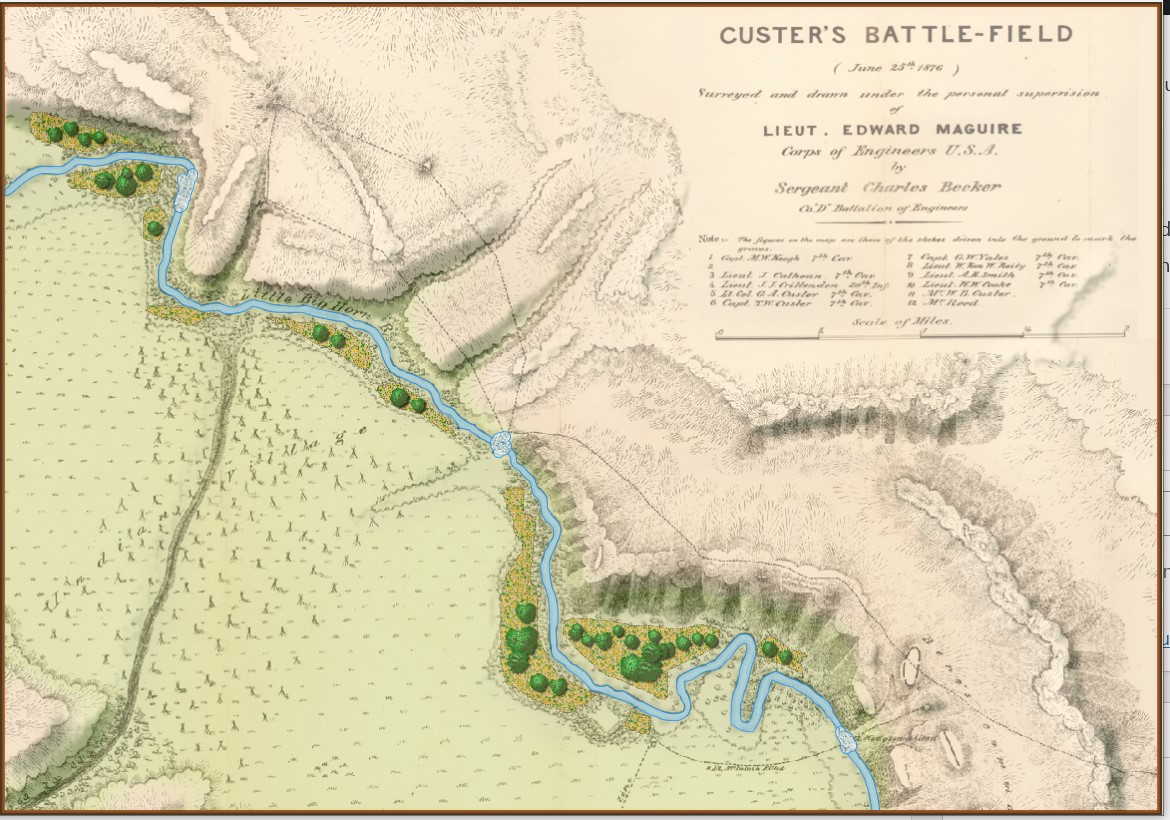
Fantastic map of the Little Bighorn battlefield done shortly after the battle. Click to enlarge.
Little Bighorn battlefield with slope and elevation emphasized. Click to enlarge.
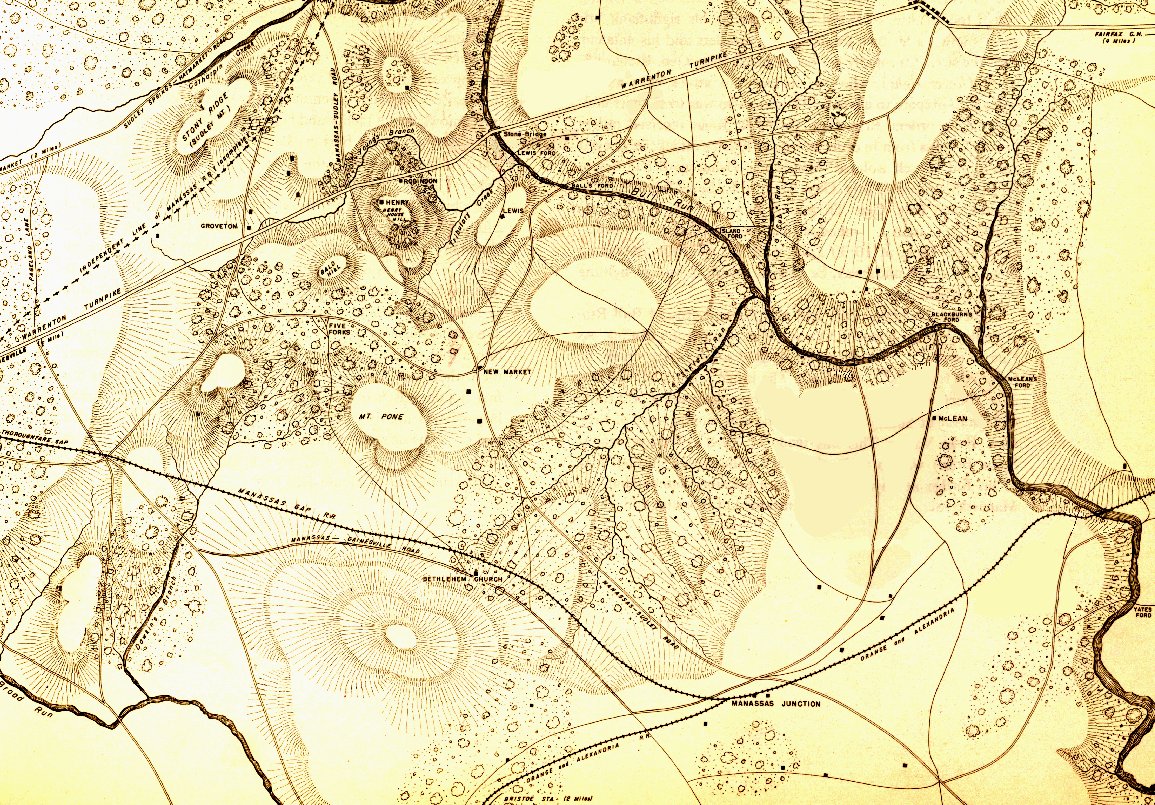
Battlefield of 1st Bull Run from the West Point Atlas of American Wars Volume 1. Click to enlarge.
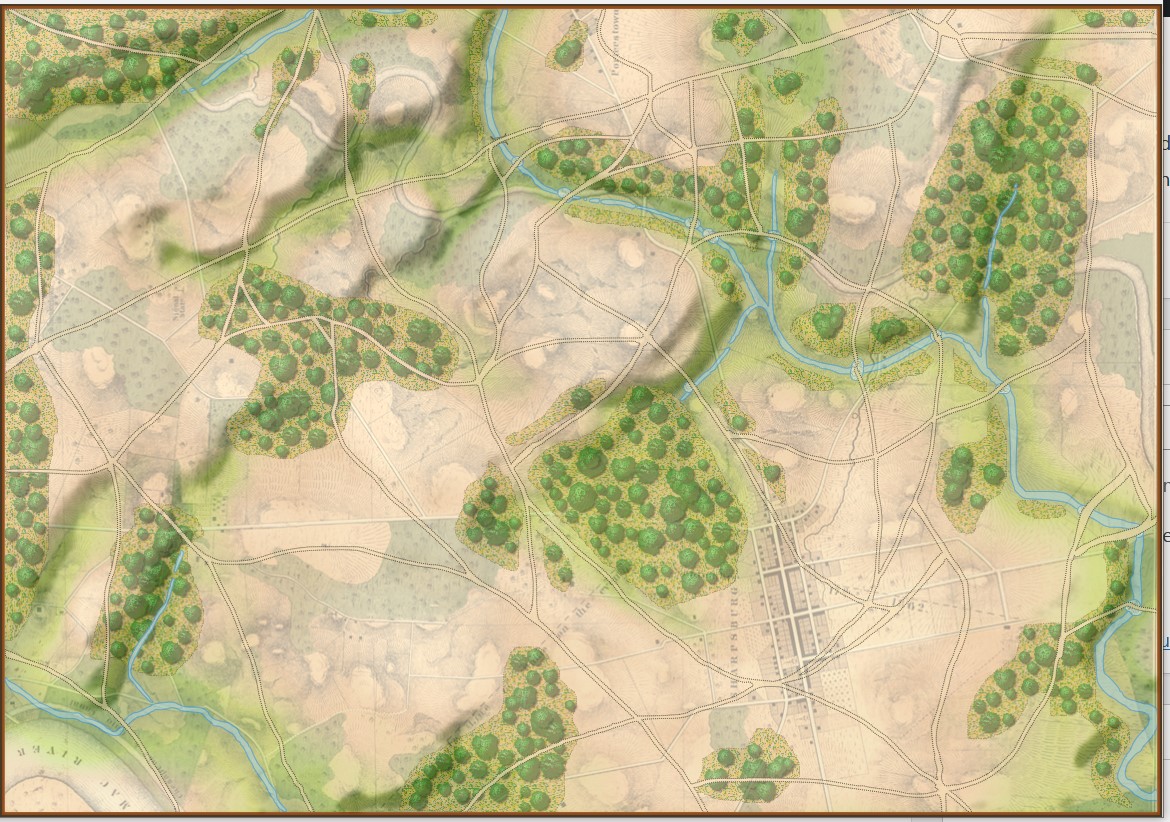
1st Bull Run battlefield with slopes and elevation emphasized. Click to enlarge.